

Davis Large Cap Value SMA Portfolio
Overview
Investment Strategy
The goal of the Davis Large Cap Value SMA Portfolio is to provide investors access to attractive investment opportunities among large cap, durable, well-managed businesses. We seek to purchase these businesses at value prices and hold them for the long term. This approach makes the Davis Large Cap Value SMA Portfolio an ideal foundation for an investor’s portfolio.
Using our signature Davis Investment Discipline, the Portfolio has generated consistent long-term outperformance versus the S&P 500® Index.1 Click here to learn more about our historical record of attractive long-term returns.
Why Invest in the Davis Large Cap Value SMA Portfolio
Sixty Years of Experience
The Davis family has compounded wealth for investors over six decades and three generations.
Long-Term Investment Results
The Davis Large Cap Value SMA Portfolio has a unique record of consistent long-term outperformance versus the S&P 500® Index.1 See the illustrations below for additional detail.
Aligned with Shareholders
With more than $2 billion invested side by side with fellow shareholders, we experience the same risks and reap the same rewards.2
| Selective | Attractive Growth | Undervalued |
|---|---|---|
|
LCV SMA invests in only a select group of well-researched companies |
LCV SMA portfolio companies have solid earnings |
LCV SMA portfolio companies are 36% less expensive than the index |
Holdings** |
5-Year EPS Growth** |
P/E (Forward)** |
|
503
28
LCV
S&P500
|

Performance as of 6/30/24
1) Compounding Wealth - To be one of the very best over the long term does not mean you have to be number one every year.
As the chart below illustrates, from 4/1/69–6/30/24 Davis Large Cap Value delivered an average annualized return of 12.4%—remarkably outperforming the S&P 500® Index by an average of 1.9% per year.3
A hypothetical $100,000 investment in Davis Large Cap Value in 1969 has compounded to $62,548,862, while the S&P 500® Index compounded into only $25,872,510 over that same time period. (Gross of fees. See below for net of fee returns.)
We have been able to create superior long-term investment results, despite the inevitable and expected fact that other investments may have outperformed the Portfolio in any particular year.
| Year | Davis Large Cap Value SMA Composite (gross of fees) |
S&P 500® Index |
|---|---|---|
| 1969 | 19.9% | -7.0% |
| 1970 | -25.3% | 4.0% |
| 1971 | 29.7% | 14.3% |
| 1972 | 23.3% | 19.0% |
| 1973 | -23.5% | -14.7% |
| 1974 | -19.4% | -26.5% |
| 1975 | 24.5% | 37.2% |
| 1976 | 22.0% | 23.9% |
| 1977 | 5.6% | -7.2% |
| 1978 | 20.6% | 6.6% |
| 1979 | 40.3% | 18.6% |
| 1980 | 45.4% | 32.5% |
| 1981 | 2.2% | -4.9% |
| 1982 | 26.6% | 21.6% |
| 1983 | 24.3% | 22.6% |
| 1984 | 5.9% | 6.3% |
| 1985 | 38.9% | 31.7% |
| 1986 | 23.1% | 18.7% |
| 1987 | -0.6% | 5.3% |
| 1988 | 22.5% | 16.6% |
| 1989 | 35.9% | 31.6% |
| 1990 | -2.0% | -3.1% |
| 1991 | 41.8% | 30.4% |
| 1992 | 13.1% | 7.6% |
| 1993 | 15.6% | 10.1% |
| 1994 | -1.4% | 1.3% |
| 1995 | 40.9% | 37.5% |
| 1996 | 28.4% | 22.9% |
| 1997 | 35.6% | 33.4% |
| 1998 | 15.9% | 28.6% |
| 1999 | 18.9% | 21.0% |
| 2000 | 10.7% | -9.1% |
| 2001 | -10.7% | -11.9% |
| 2002 | -16.7% | -22.1% |
| 2003 | 30.9% | 28.7% |
| 2004 | 12.6% | 10.9% |
| 2005 | 10.0% | 4.9% |
| 2006 | 14.2% | 15.8% |
| 2007 | 2.9% | 5.5% |
| 2008 | -36.1% | -37.0% |
| 2009 | 27.9% | 26.5% |
| 2010 | 11.3% | 15.1% |
| 2011 | 0.3% | 2.1% |
| 2012 | 12.6% | 16.0% |
| 2013 | 32.7% | 32.4% |
| 2014 | 7.9% | 13.7% |
| 2015 | 2.1% | 1.4% |
| 2016 | 13.3% | 12.0% |
| 2017 | 20.9% | 21.8% |
| 2018 | -12.9% | -4.4% |
| 2019 | 33.4% | 31.5% |
| 2020 | 15.2% | 18.4% |
| 2021 | 19.8% | 28.7% |
| 2022 | -21.0% | -18.1% |
| 2023 | 36.0% | 26.3% |
| 6/30/2024 | 14.9% | 15.3% |
| Cumulative Total Return | 62449% | 25773% |
| Average Annual Rate of Return | 12.4% | 10.6% |
| Value of a Hypothetical $100,000 Initial Investment | $62,548,862 | $25,872,510 |
| Average Annual Total Returns as of June 30, 2024 Large Cap Value Portfolio |
YTD* | 1 Year |
3 Years |
5 Years |
7 Years |
10 Years |
15 Years |
20 Years |
25 Years |
30 Years |
40 Years |
50 Years |
|---|---|---|---|---|---|---|---|---|---|---|---|---|
| gross | 14.90% | 29.65% | 6.44% | 13.87% | 12.14% | 10.97% | 12.88% | 9.03% | 7.80% | 10.81% | 12.79% | 14.05% |
|
with a 3% maximum wrap fee |
13.23% | 25.89% | 3.31% | 10.53% | 8.84% | 7.71% | 9.57% | 6.00% | 5.27% | 8.54% | 10.86% | 12.33% |
* YTD is not annualized.
The performance presented represents past performance and is not a guarantee of future results. Total return assumes reinvestment of dividends and capital gain distributions. Investment return and principal value will vary so that, when redeemed, an investor’s account may be worth more or less than their original cost. Current performance may be higher or lower. Total return updates are available quarterly. Please ask your financial advisor to contact Davis Advisors.
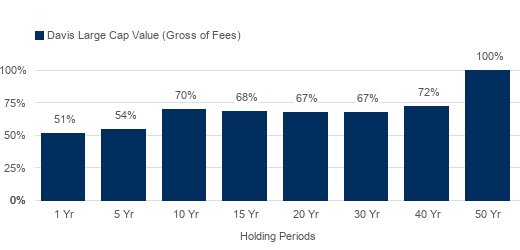
2) Patience is a Virtue - By steadfastly adhering to our investment discipline through ever-changing market and economic environments, the Davis Large Cap Value Portfolio has generated an uncommon record of consistent long-term outperformance versus the S&P 500® Index.
The chart below shows the percentage of time since 1970 the Portfolio has outperformed the S&P 500® Index over various time periods. Patient investors outperformed the S&P500 in 70% of all 10 year periods. As investor holding periods increased, the likelihood of outperforming the index increased.
This track record covers periods of inflation, deflation, high interest rates, low interest rates, political crisis, wars, and more.
Percent of Time the Davis Large Cap Value Portfolio Has Outperformed the Market (1/1/70–6/30/24)4
Source: Thomson Financial, Lipper, Bloomberg, and Davis Advisors. Past performance is not a guarantee of future results.
Portfolio Characteristics as of 6/30/24
Portfolio Composition
| Davis Large Cap Value Portfolio |
S&P 500® Index |
|
|---|---|---|
| Forecast P/E Ratio | 14.6 | 22.9 |
| P/B Ratio | 3.2 | 4.7 |
| Weighted Average Market Cap ($bn) | 443.1 | 948.3 |
| Beta (3 year) | 1.0 | 1.0 |
| Standard Deviation (5 year) | 20.6 | 19.5 |
| Number of Holdings | 28 | 503 |
| Turnover | 17.3 | 2.6 |
Top 10 Holdings
| Applied Materials | 7.0% |
| Berkshire Hathaway | 7.0% |
| Capital One Financial | 7.0% |
| Meta Platforms | 7.0% |
| Amazon.com | 6.9% |
| Wells Fargo | 5.6% |
| Humana | 5.5% |
| Alphabet | 4.7% |
| Viatris | 4.3% |
| Texas Instruments | 4.1% |
Click here for quarter-end holdings
Top Sectors
| Financials | 32.7% |
| Health Care | 17.2% |
| Information Technology | 16.0% |
| Communication Services | 13.2% |
| Consumer Discretionary | 10.5% |
| Industrials | 3.9% |
| Materials | 3.3% |
| Consumer Staples | 2.0% |
| Energy | 1.2% |
Literature
| Insights into the Portfolio | ||
|---|---|---|
| Fact Sheet | Download Share | Goals of the Portfolio, top holdings, characteristics and Portfolio attributes. |
|
Davis Large Cap SMA: Attractive Growth. Undervalued. World Class Businesses. |
Download Share | Distinguished by companies with earnings growth significantly higher and P/Es significantly lower than the Index – World-class businesses positioned for opportunities in today’s market † |
| A History of Outperformance | Download Share | Discusses the Davis Large Cap Portfolio's growing success in beating the S&P500® as the holding period increased (ultimately reaching 100%). |
| Quarterly Review Book: Davis Large Cap Value SMA | Download Share | A comprehensive quarterly update on the Portfolio, including commentary on investment strategy, performance and Portfolio statistics, and holdings. |
| Davis Large Cap SMA: Selective. Attractive Growth. Undervalued. | Download Share | Our companies are rigorously researched, offer attractive growth and yet are significantly undervalued versus the benchmark – A powerful combination. |
| Portfolio Commentaries | ||
| Large Cap Value Portfolio Commentary - Spring Update 2024 | Download View Share | A quarterly discussion of the market environment, Portfolio performance, major positions, and investment opportunities. |
| Insights into Successful Investing | ||
| Fortune Magazine – Warren Buffett: “Why stocks beat gold and bonds” | Download Share | Warren Buffett on the real danger of investments commonly thought of as “safe”, and why “productive assets” like equities offer a much better chance of maintaining purchasing power (compounding wealth after taxes and inflation). |
This material may be shared with existing and potential clients to provide information concerning market conditions and the investment strategies and techniques used by Davis Advisors to manage its client accounts. Please refer to Davis Advisors Form ADV Part 2 for more information regarding investment strategies, risks, fees, and expenses. Clients should also review other relevant material, including a schedule of investments listing securities held in their account.
The Davis Large Cap Value Portfolio is represented by Davis Advisors’ Large Cap Value SMA Composite. See Performance disclosure for a description of the Composite.
1Gross of fees. Returns discussed are from the first full year after inception of the Large Cap Value Composite (4/1/69) through 6/30/24. Past performance is not a guarantee of future results.
2As of June 30, 2024.
3Gross of fees.
4The performance shown does not include fees and the percent of time the portfolio has outperformed the market would be lower if fees were included.
** The Attractive Growth and Undervalued reference relates to underlying characteristics of the portfolio holdings. There is no guarantee that the Fund performance will be positive as equity markets are volatile and an investor may lose money. Past performance is not a guarantee of future returns. Performance may vary. Five-Year EPS Growth Rate is the average annualized earning per share growth for a company over the past five years. The values for the portfolio and index are the weighted average of the five-year EPS Growth Rates of the stocks in the portfolio or index. Forward Price/Earnings (Forward P/E) Ratio is a stock’s current price divided by the company’s forecasted earnings for the following 12 months. The values for the portfolio and index are the weighted average of the P/E ratios of the stocks in the portfolio or index.
(1) Read here for objective/risk disclosures
(2) Read here for performance/rolling return disclosures
Davis Selected Advisers, L.P., 2949 East Elvira Road, Suite 101, Tucson, AZ 85756